Understanding Polling Data in politics

Polling data in politics is like the weather forecast for democracy—it gives us a glimpse into the public’s mood and predictions for upcoming elections. But just like predicting the weather, understanding polling data can be tricky. Here’s your go-to guide for making sense of those numbers and what they really mean for politics.
The Fab Four: Types of Polls
Opinion Polls: These are snapshots of public opinion on issues and candidates, taken at a specific moment.
Exit Polls: Conducted as voters leave the polling station on election day, offering a first look at who might win.
Tracking Polls: These polls check the pulse of public opinion over time, showing how views change.
Push Polls: Designed to sway rather than measure opinion, these are more about influencing voters than collecting honest feedback.
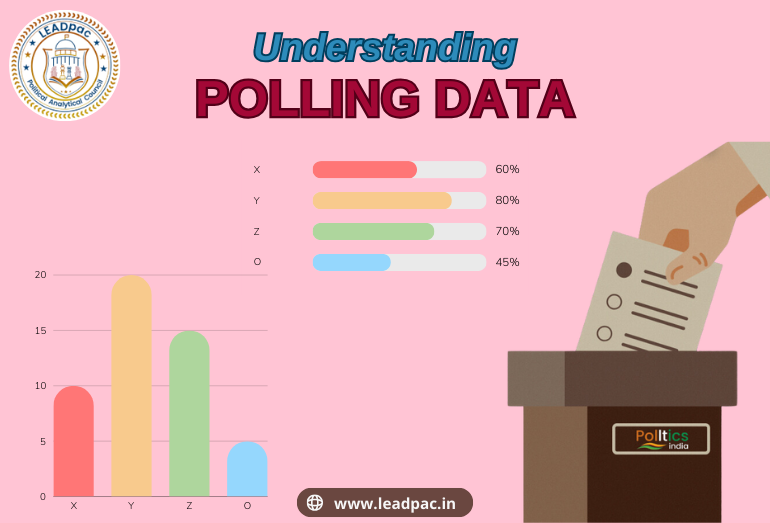
Polling data is a political pulse check, translating public opinion into actionable insights.
Under the Hood: What Makes a Poll?
Sample Size: The more, the merrier. Bigger samples mean more reliable results.
Margin of Error: The wiggle room in the results. Smaller margins mean more precise readings.
Sampling Method: Random sampling is king for fairness.
Question Wording: Keep it clear and neutral to get genuine answers.
Timing: Conducted at the right moment to capture current sentiments.
Decode the Numbers: Reading Poll Results
Lead and Spread: Who’s ahead and by how much.
Trend Analysis: Look at how opinions change over time, not just one poll.
Crosstabs: Breakdowns by age, gender, race, etc., to see who’s thinking what.
Weighting: Adjusting results to reflect the real-world population.
Watch Out: Common Poll Pitfalls
Nonresponse Bias: If certain groups don’t answer, results can be skewed.
Social Desirability Bias: People might say what they think is socially acceptable rather than their true thoughts.
Question Order Bias: The sequence of questions can influence answers.
Spotting Quality: What Makes a Good Poll?
Reputable Source: Trustworthy organizations with a history of accuracy.
Transparency: Clear about methods, sample size, and question wording.
Independent Verification: Results confirmed by other reliable polls.
Real-World Action: Polls in Play
Election Forecasting: Aggregating multiple polls gives a clearer picture of likely outcomes.
Policy Making: Lawmakers use polls to gauge public support for initiatives.
Campaign Strategies: Tailoring messages and targeting voter groups based on poll data.
Stats Speak: Key Concepts
Confidence Interval: The range where the true value lies with a certain level of confidence.
Regression Analysis: Identifying relationships between variables and predicting outcomes.
Weighting Adjustments: Correcting sample imbalances to reflect the actual population.
Ethics First: Playing Fair with Polls
Transparency: Full disclosure of methods and limitations.
Accuracy: Striving for the most precise results.
Non-partisanship: Keeping polls free from bias and political influence.
Wrap-Up: Polls Unwrapped
Think of polling data as your political GPS. It guides campaigns, informs voters, and helps predict outcomes. By understanding the science behind the numbers, you can better navigate the political landscape and see beyond the headlines. Stay informed, question the data, and you’ll be a savvy poll reader in no time!
